

Everyone in sales wants growth. But they do not buy growth the same way
Four commercial leaders hear the same pitch: “We help you grow faster.” The sales manager thinks about deals that need to close this month. The head of sales wonders whether the forecast will become more reliable. The CRO wants proof that additional growth will not become prohibitively expensive. The commercial director asks what that growth will do to margins and important customer relationships.
Those are not just differences in vocabulary. The same investment carries different business and personal consequences for each role. Neurofactor’s broad audience profiles reflect this in their goals, fears, objections, evidence requirements and time preferences. The profile scores also differ, from BAS 9 for the CRO to BIS 6 and k 0.15 for the commercial director.
When you sell to sales, “more revenue” is not a complete proposition. You must show what kind of revenue, for whom, how soon and at what risk.
Growth is not a single buying argument
“More revenue” sounds universally attractive. Yet a sales manager may read it as additional closed deals, a head of sales as a reliable sales process, a CRO as improved funnel economics and a commercial director as greater customer value without sacrificed margin. The same headline therefore points to four different decisions.
A generic growth promise pushes the buyer to translate the claim into their own business problem. That creates unnecessary friction when they also need to justify spending and protect what they are accountable for.
Four sales roles, four different buying questions
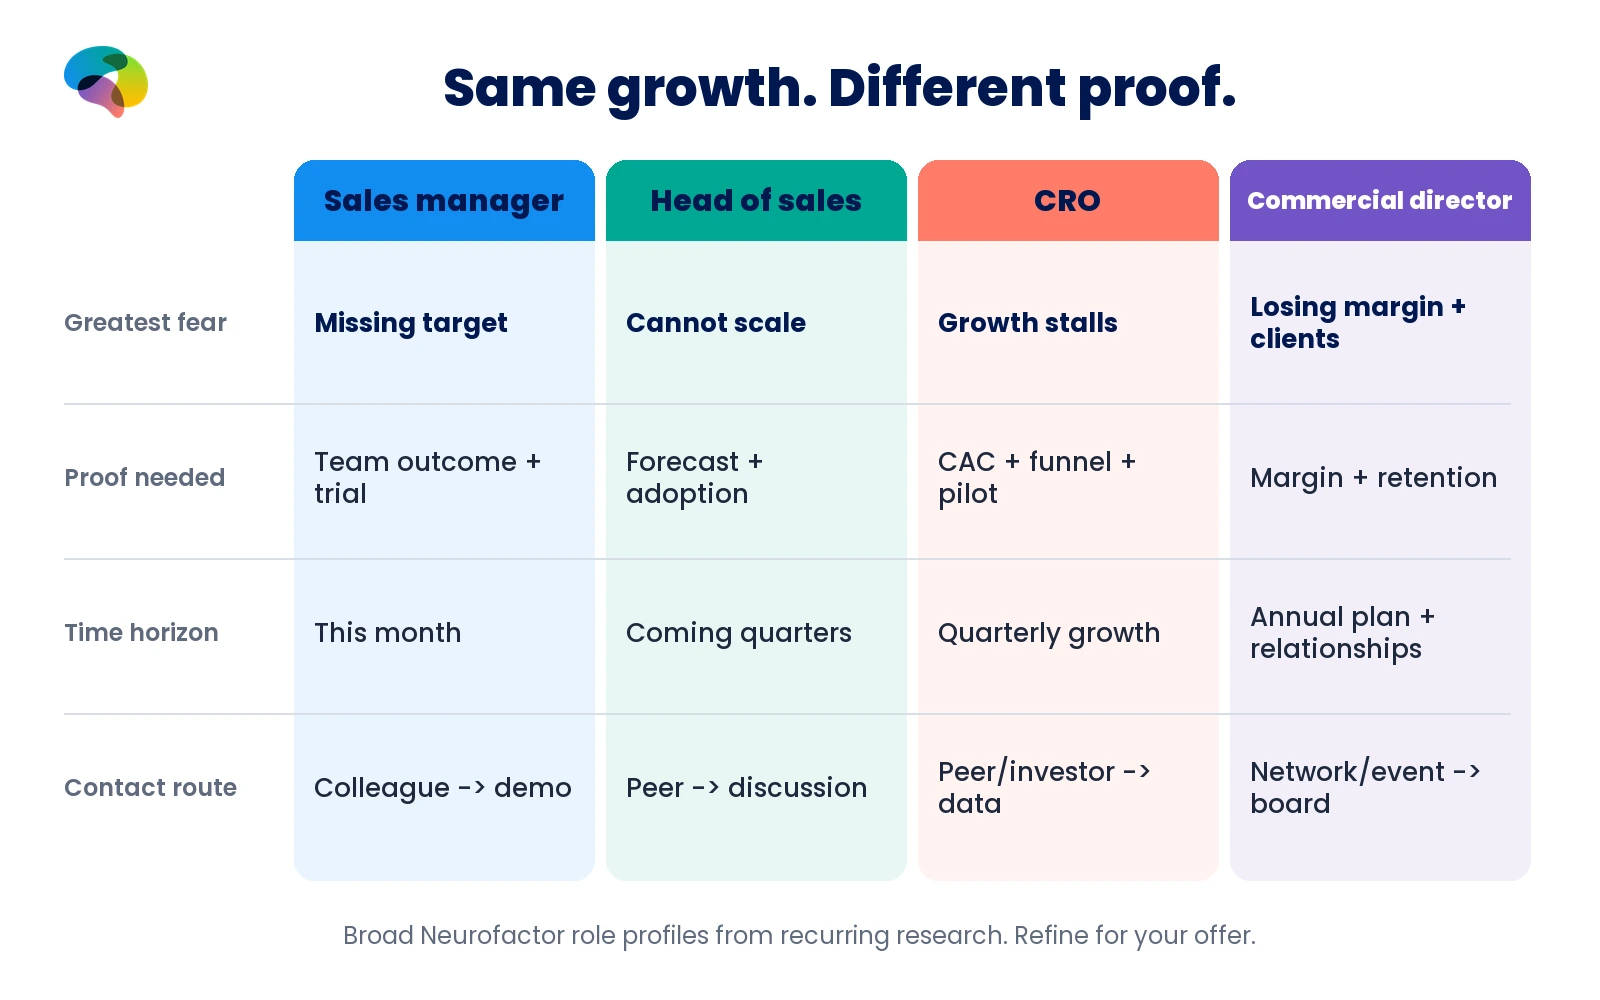
This table draws directly on the source audience cards: primary pain, greatest fear, proof required, preferred contact route and time preference. It describes broad role profiles, not every person holding a particular title.
Pain
- Sales manager
- Inconsistent team targets; dependence on star performers
- Head of sales
- Unreliable pipeline and forecast
- CRO
- Growth stalls or costs too much
- Commercial director
- Price pressure erodes margin and key accounts
Greatest fear
- Sales manager
- Missing targets and losing the team
- Head of sales
- Discovering the organisation cannot scale
- CRO
- Growth stops and spending does not pay back
- Commercial director
- Losing margin and strategic clients
Desired result
- Sales manager
- More deals from existing leads
- Head of sales
- Reliable forecast and repeatable approach
- CRO
- More provable revenue per invested euro
- Commercial director
- Value-based sales, protected margins and retention
Proof
- Sales manager
- Fast team results, peer reference, trial
- Head of sales
- Forecast and growth cases, sector peers
- CRO
- Funnel, CAC, growth figures, benchmarks, measured pilot
- Commercial director
- Margin and retention cases, industry peers
Preferred route
- Sales manager
- Colleague referral, short demo or trial
- Head of sales
- Peer network, substantive conversation, demo
- CRO
- Investor or peer-community introduction, data discussion
- Commercial director
- Personal network or industry event, board presentation
Time preference in profile
- Sales manager
- k 0.40
- Head of sales
- k 0.25
- CRO
- k 0.30
- Commercial director
- k 0.15
Who is accountable when the investment disappoints?
The sales manager carries the visible pressure of monthly and quarterly targets. The head of sales must explain forecasting errors and why a new sales process is still used after the launch. The CRO is accountable for the ratio between revenue growth and investment to leadership or investors. The commercial director protects pricing, relationships and long-term commercial resilience.
This is why a revenue uplift alone is incomplete evidence. A rise in conversion does not automatically prove CRM adoption, profitability or retention of strategic accounts. The relevant case must address the outcome for which that particular role is responsible.
Sales manager: will my team close more deals this month?
The source profile identifies inconsistent target attainment and overreliance on a few strong sellers as the central pain. Uneven skills, too little coaching time and incomplete CRM records make the problem harder. The emotional pressure is personal: the manager is visible when the numbers slip.
A proposed solution must fit everyday sales routines. Show what reps will do differently tomorrow, how much work it adds and which early indicators suggest improvement. The card asks for quick results in comparable teams, references from other sales managers and a trial. A lengthy one-off training day or an unused dashboard is not persuasive evidence.
The recorded objections are equally specific: “no time”, “the team will not use it” and “we already have a CRM or trainer”. Selling the impact means proving that impact can be achieved without yet another administrative burden.
Head of sales: can we finally trust our pipeline?
The head of sales faces a different failure: the pipeline is unpredictable and forecasts repeatedly miss. According to the source, sales has grown around individuals rather than a common process. Tools accumulate, good sellers leave and another rollout risks ending as shelfware.
The buying question therefore moves from an immediate conversion boost to a dependable operating model. How quickly can new hires ramp up? How are playbooks embedded in CRM and coaching? What indicates forecast accuracy is improving? The desired benefit is control over the commercial engine, not an isolated revenue spike.
The head of sales expects method and operational reinforcement. Lead with forecast accuracy, growth outcomes and evidence of adoption. The objection “we have bought tools before that never stuck” is not solved by a more impressive feature demo.
CRO: what is the growth return on every euro invested?
The source CRO profile owns overall revenue and focuses on the funnel, customer acquisition cost, collaboration between sales and marketing and repeatable results. Its primary pain is stagnation or rising costs per euro of revenue. The board’s demand for both faster growth and lower costs makes the challenge more acute.
BIS 4, BAS 9 and k 0.30 suggest a strong orientation towards growth opportunities within this broad profile. But this is not permission to pitch unbounded experimentation. The source objection is explicit: “prove it works in our segment; I want data, not assumptions”. A compelling conversation therefore starts with a measurable growth mechanism, a baseline and transparent metrics.
Demonstrate which funnel stage should improve, the implications for CAC and how an observed change can be distinguished from other factors. Offer a measured pilot and an honest dashboard. Lead volume without conversion, cost and retention context will leave the central question unanswered.
Commercial director: are these the right euros to earn?
The commercial director safeguards market position, margins, strategic accounts and value-based selling. The source card names loss of margin and major customers to cheaper competitors as the greatest fear. Higher order volume with worse terms may therefore make the offer less attractive, not more.
This role has the highest BIS among the four (6), BAS 6 and the lowest k (0.15). The surrounding source fields point to risk management around margins, annual planning and enduring relationships. The commercial horizon extends beyond the next deal to the quality of revenue retained.
Required evidence is specific: cases showing margin improvement and customer retention, supported by peers in comparable sectors. The preferred route is a personal introduction or industry event followed by an executive presentation. Pure volume-growth cases without price quality, retention or relationship risk miss the point.
The full BIS, BAS and k source scores
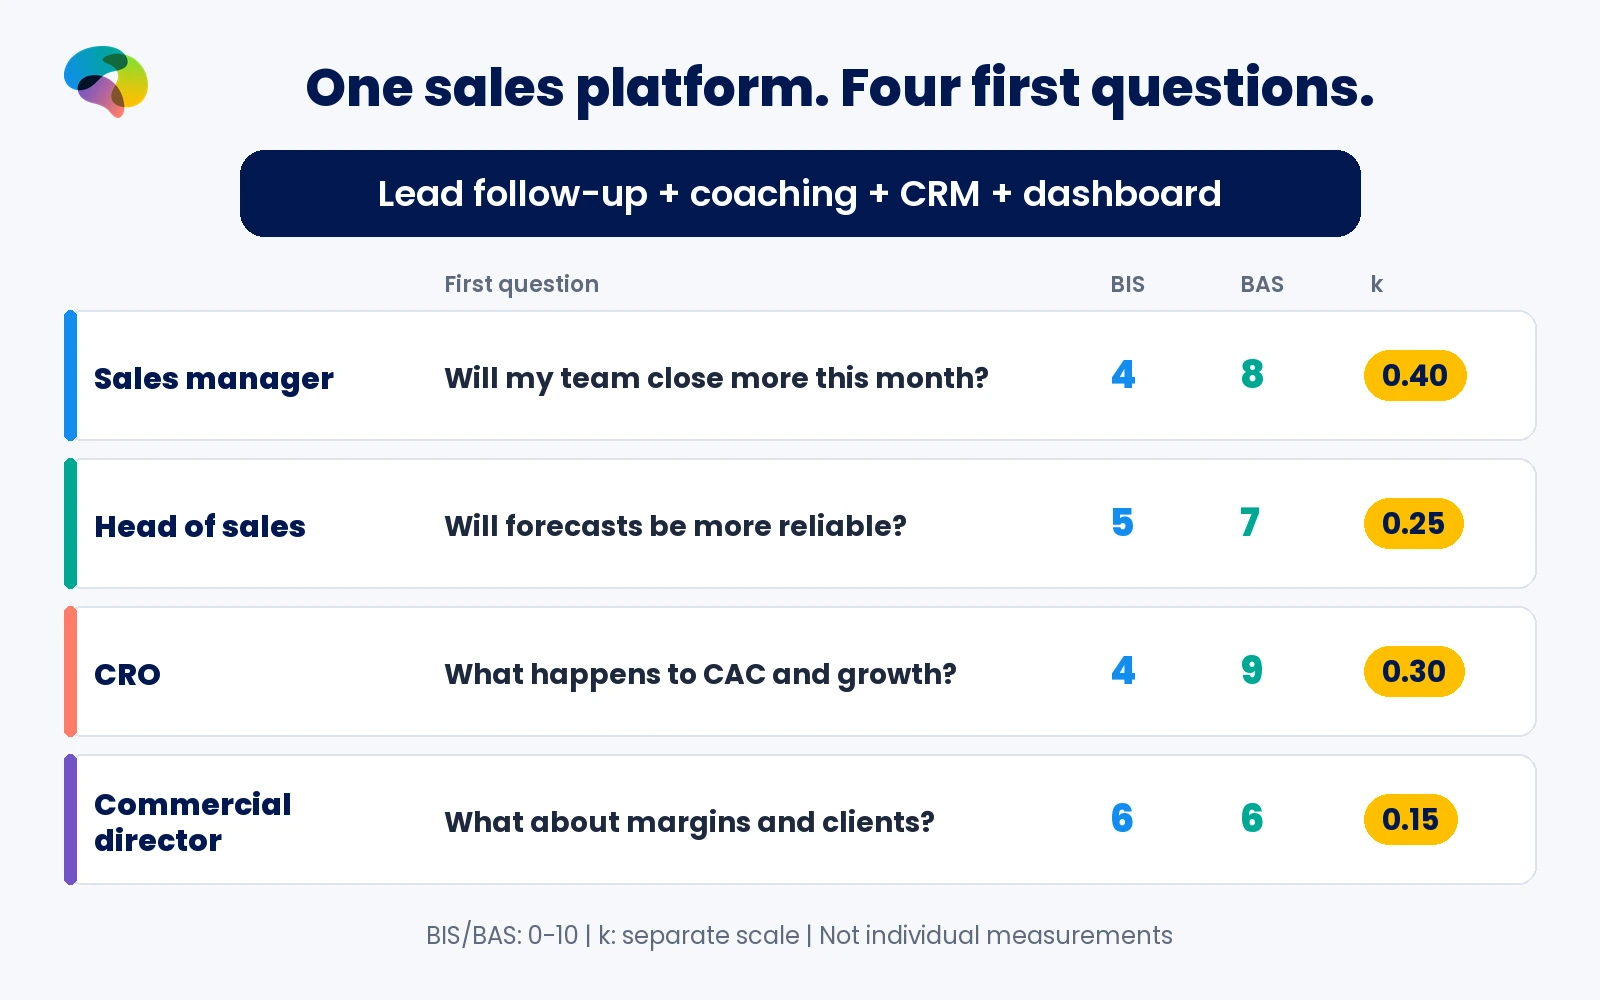
These values come from rows 44-46 of the original “3 Sales” worksheet. BIS and BAS use the source model’s 0-10 scale. k is a separate delay-discounting parameter, not a percentage or a score on the same axis. The values describe broad roles, not individual test results.
BIS (0-10)
- Sales manager
- 4
- Head of sales
- 5
- CRO
- 4
- Commercial director
- 6
BAS (0-10)
- Sales manager
- 8
- Head of sales
- 7
- CRO
- 9
- Commercial director
- 6
k (separate parameter)
- Sales manager
- 0.40
- Head of sales
- 0.25
- CRO
- 0.30
- Commercial director
- 0.15
Why the scores alone cannot predict a decision
The CRO has the highest BAS yet explicitly asks for a measured pilot and segment-specific evidence. The sales manager shares the relatively low BIS but prioritises this month’s team performance. The head of sales, with BIS 5, needs sustainable adoption. The commercial director, with BIS 6, gives greater weight to margin erosion and customer risk.
Higher BAS is not an automatic yes to a bold pitch. Higher BIS is not an automatic no to innovation. Each score gains meaning when read alongside the pain, greatest fear, failed earlier solutions and proof that the role trusts. The knowledge base explains how BIS and BAS work together and what delay-discounting k means.
k helps describe a relative preference for earlier over later rewards; it does not predict a signing date. The other fields explain why the sales manager wants near-term evidence and the commercial director works with annual plans and relationships.
One sales platform. Four completely different questions.
Imagine a hypothetical platform combining lead follow-up, coaching, CRM hygiene and revenue dashboards. Its promise is “more revenue from the same sales organisation”. No actual outcome or client case is being claimed. The following reactions are editorial illustrations grounded in the profile fields, not quotations collected from research participants.
The sales manager asks: “Will reps close more deals tomorrow without more administration?” The head of sales asks: “Will our forecast become more reliable, and will the process scale?” The CRO asks: “What happens to CAC, funnel conversion and net revenue growth?” The commercial director asks: “Will margins and customer relationships improve, or are we buying volume?”
The product is the same; the business case is not. Different people can watch the same demo and reach different conclusions because the proof each needs is missing.
How to change the first sales conversation
Start with the decision problem rather than using a job title as a personality label. Use the source role card as preparation, then check whether its pattern matches the actual buying situation.
- Sales manager: start with team quotas and conversion from existing leads. Offer a small working trial, with clear workload and adoption expectations.
- Head of sales: ask where forecasts diverge and where playbooks break down. Bring a process map, CRM adoption plan and relevant peer case.
- CRO: set a measurement plan against CAC, funnel conversion and segment performance. Agree baseline, pilot metrics and failure criteria up front.
- Commercial director: open with gross margin, pricing quality, retention and strategic customers. Use margin cases and involve the executive team appropriately.
- Match the introduction to the source card: colleague referral for sales manager, head-of-sales peers for the functional leader, investor or peer introduction for the CRO, personal or industry networks for the commercial director.
- Where multiple roles decide together, build one coherent proposition with a different evidence layer for each stakeholder.
Four opening lines for the same offer
These are illustrative sales-copy examples, not tested wording or verbatim research responses. The underlying problems and preferred evidence follow the original audience cards.
- Sales manager: “You have enough leads, but conversion varies across reps. Shall we test one simple routine with one team and see what it changes?”
- Head of sales: “Your forecast should give you confidence, not another surprise. Let us start with the stages that are not consistently recorded in CRM.”
- CRO: “If revenue rises while acquisition becomes more expensive, we need to identify which funnel stage is reducing the return. Let us measure that first.”
- Commercial director: “Growth built on discounts and pressure on strategic accounts is not the growth you need. Let us start with margin and customer value.”
What if all four roles influence the purchase?
In a larger buying group, a sales manager may be the daily user and champion, the head of sales the process owner, the CRO the sponsor of the growth case and the commercial director a strategic co-decision-maker. That is an illustration, not a prescribed organisation chart. Actual responsibilities vary by company.
You then need evidence at different levels: a manageable trial with one team, a CRM adoption and enablement approach, a measurement plan for funnel outcomes and CAC, and a margin and retention perspective. Proof in one layer does not substitute for the others.
Ask four questions: who will use this, who defends the budget, who bears the risk if it fails and what needs to improve by when? That moves the discussion from four isolated sales pitches to one decision process.
A research-informed broad role profile is not a product-specific prediction
These profiles draw on recurring patterns from Neurofactor research involving these and comparable audiences over multiple years. They provide research-informed, broadly generalised role profiles of how business decision-makers weigh problems, evidence and choices. They do not literally describe every individual sales manager, head of sales, CRO or commercial director.
Sector, company size, sales maturity, pricing, product type, proposition and decision context can change the pattern. A CRO at an industrial manufacturer need not decide like one at a SaaS scale-up. These values are not EEG readings from individual buyers and are not probabilities of purchase.
For the greatest commercial usefulness, refine the broad profile for your actual product or service. Use the evidence fields in an audience card and a context-specific association map to understand which meanings, objections and proof cues are genuinely relevant. Want to know what the profile looks like for your specific offer? That refinement is the next step.
Want to know how sales managers, heads of sales, CROs or commercial directors see your product or service? Contact Neurofactor and translate the broad profile into your proposition.
Which LinkedIn content fits each role?
The source also differentiates channel preferences and tone. Sales managers use LinkedIn daily as readers and networkers, alongside podcasts and YouTube; practical, energetic content respects their time. Heads of sales use LinkedIn, peer communities and webinars, and expect methodical explanations. CROs are more actively posting on LinkedIn and engage with SaaS resources and peers; data-rich analyses can fit their source profile.
Commercial directors use LinkedIn more selectively and also engage with trade publications, industry events and financial media. A measured case about margin and strategic customer retention is closer to the source tone than a loud growth hack. These are broad channel patterns, not verified response rates for each individual.
Job-title targeting is therefore only the starting point. The message, proof and distribution deserve their own tests. See tone of voice in an audience card and handling objections through audience research.
Key terms
- Audience card
- A structured profile of an audience, including goals, pains, fears, objections, proof requirements and decision context.
- Association map
- A researched overview of meanings and associations linked to a brand, topic, product or service in a specific audience and decision setting.
- BIS
- Behavioral Inhibition System: in this source model, the relative salience of potential threats, risks and negative consequences on a 0-10 scale.
- BAS
- Behavioral Activation System: in this source model, the relative tendency to approach attractive opportunities and rewards on a 0-10 scale.
- Delay-discount rate (k)
- A parameter describing how the value of a delayed reward declines relative to an earlier one; not a percentage, likelihood of buying or calendar deadline.
- CAC
- Customer acquisition cost: the cost of winning one customer under a clearly defined accounting and attribution method.
- Forecast accuracy
- The degree of agreement between expected and actual sales results over the same period.
- Proof requirement
- The kind of data, outcome, case or reference a buyer needs to regard a business proposition as credible.
Frequently asked questions
Why does one growth promise fail to resonate with every sales role?
Because different roles must protect different outcomes. The sales manager focuses on team targets, the head of sales on predictability, the CRO on repeatable growth economics and the commercial director on margin and retention.
How does selling to a sales manager differ from selling to a CRO?
The sales manager wants immediately usable team conversion improvements with minimal additional work. The CRO needs measurable, segment-relevant evidence on funnel performance, acquisition cost and repeatable revenue, often through a tracked pilot.
What evidence matters to a head of sales?
Cases showing forecast accuracy and growth, combined with proof that the process is embedded in CRM and daily routines. Peer references from the same sector match the broad source profile.
Why might a commercial director reject a revenue growth pitch?
More volume can reduce margin or damage important accounts. The source profile therefore prioritises pricing quality, margin improvement, customer retention and sustainable market position.
What do BIS, BAS and k mean for these four profiles?
BIS and BAS describe relative emphasis on threat and reward within the source model. k describes delay discounting on a separate scale. These role values are not predictions about individual buyers.
How do I adapt an audience profile to my own product?
Start with the existing role card, then use a context-specific association map to explore the meanings, objections and proof cues triggered by your actual offer. Test the resulting messaging and evidence in practice.
Sources
- 1.Behavioral Inhibition, Behavioral Activation, and Affective Responses to Impending Reward and Punishment: The BIS/BAS Scales - Carver & White / Journal of Personality and Social Psychology (1994)
- 2.Time Discounting and Time Preference: A Critical Review - Frederick, Loewenstein & O'Donoghue / Journal of Economic Literature (2002)
Related topics
Reviewed by: Martijn den Otter · Last reviewed: 10/9/2026
Martijn den Otter
Oprichter van Neurofactor. Expert in neuromarketing en consumentenpsychologie.
LinkedIn →