
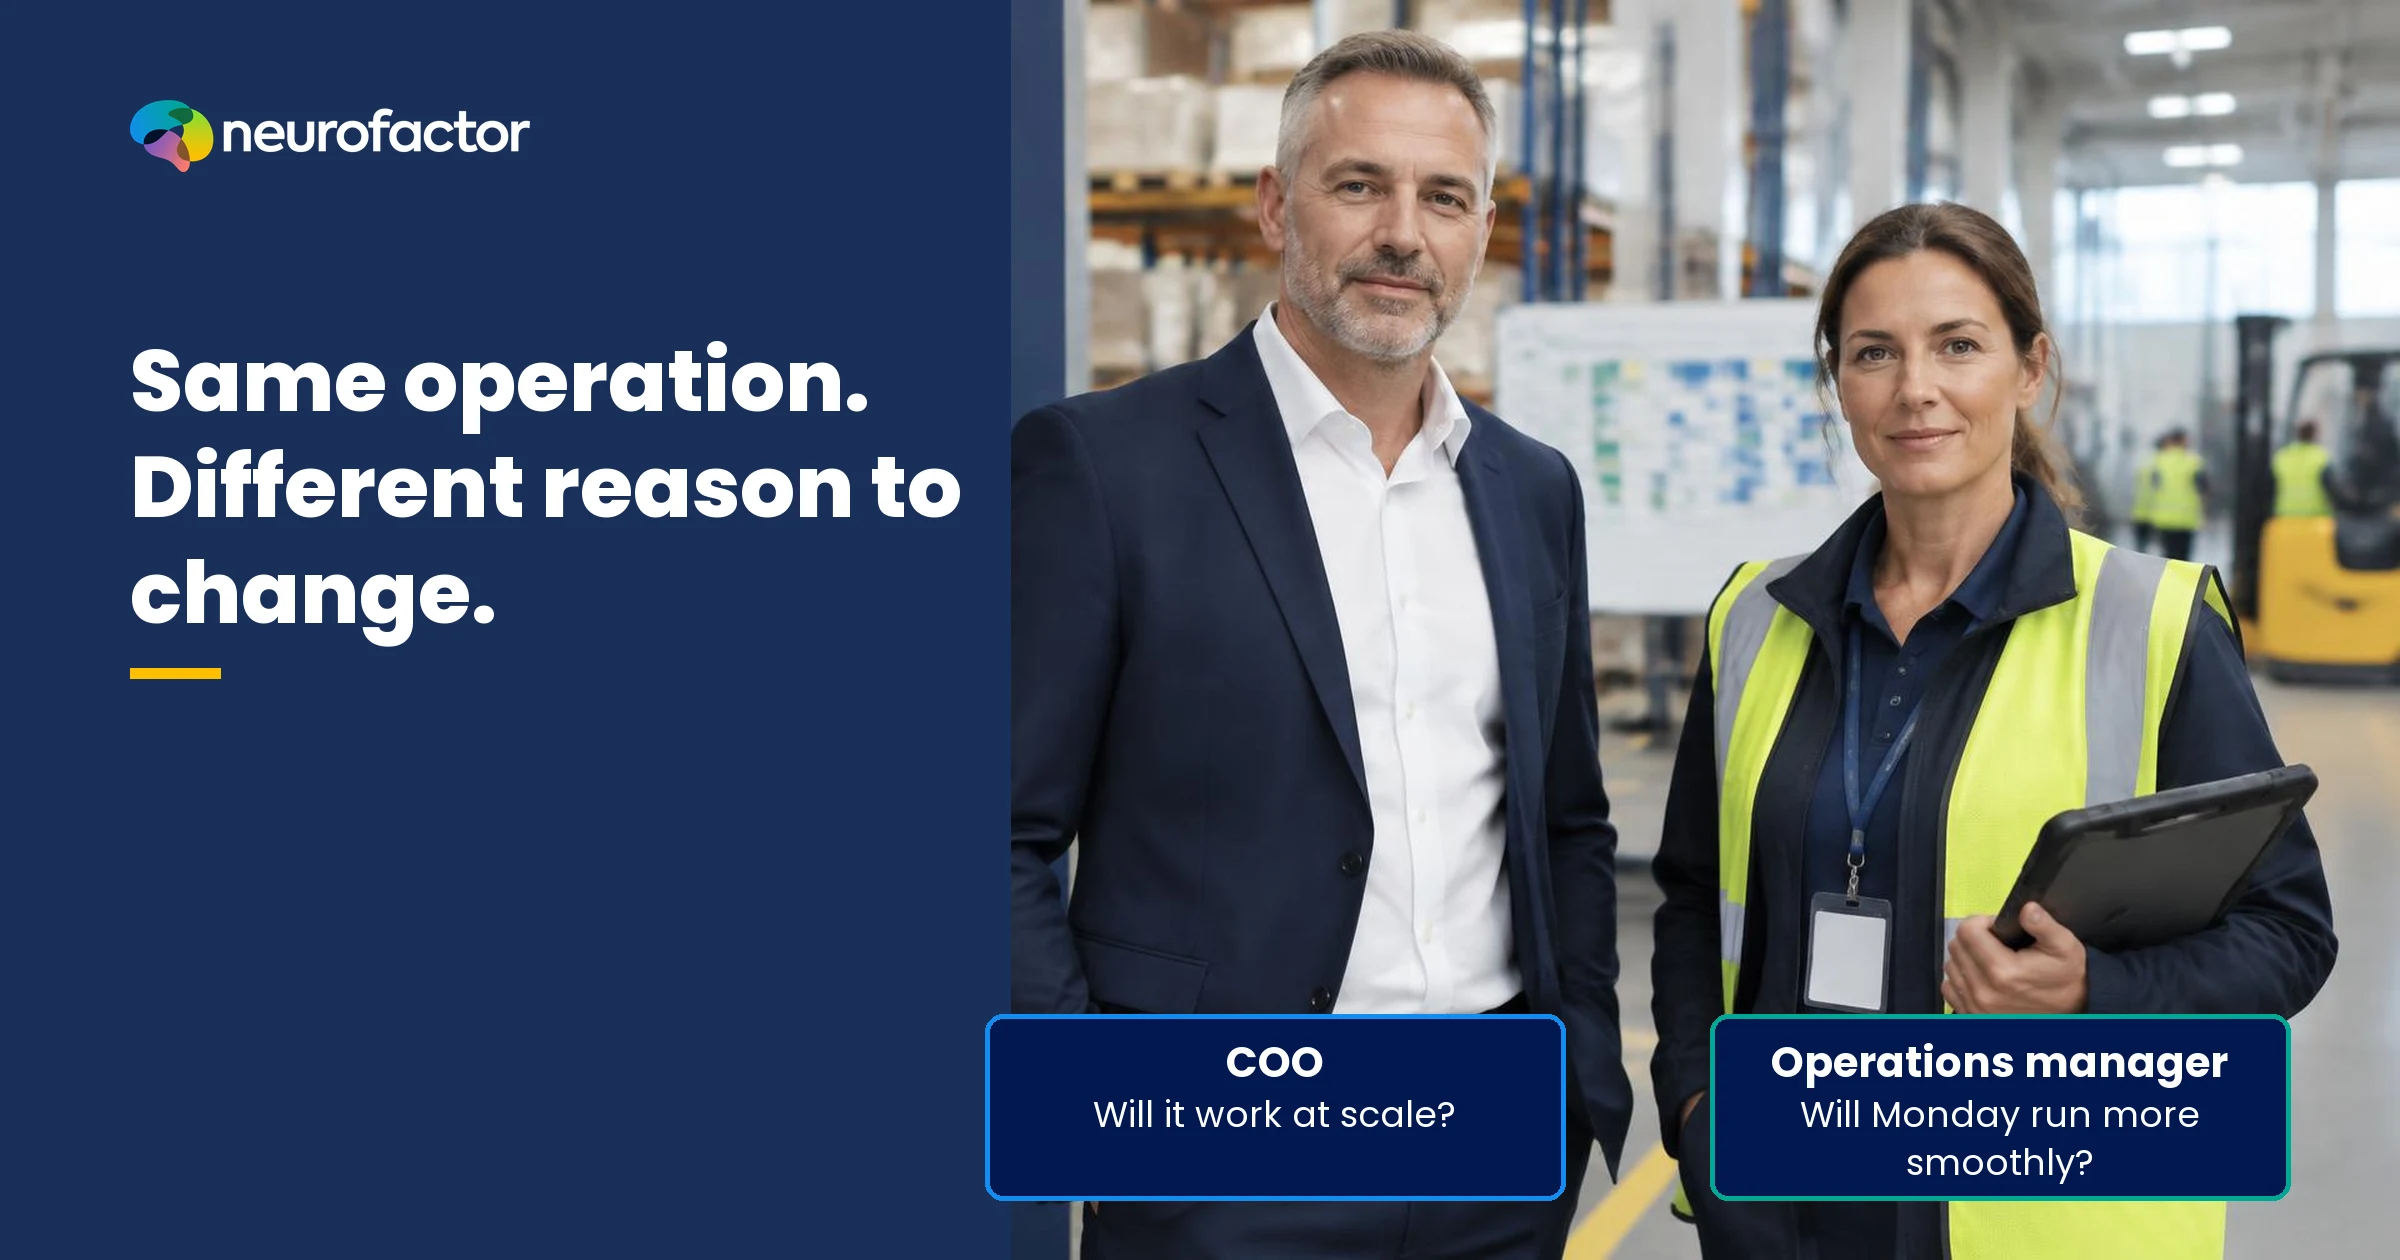
COO vs operations manager: the same operation, two different reasons to change
You present a solution that promises to improve operational efficiency. The COO asks whether it will still work across every site and what it does to cost per unit. The operations manager asks whether the team can use it on Monday without creating more incidents. Both hear the same proposal. Only one is accountable for scaling the whole operation; the other has to keep the next shift running.
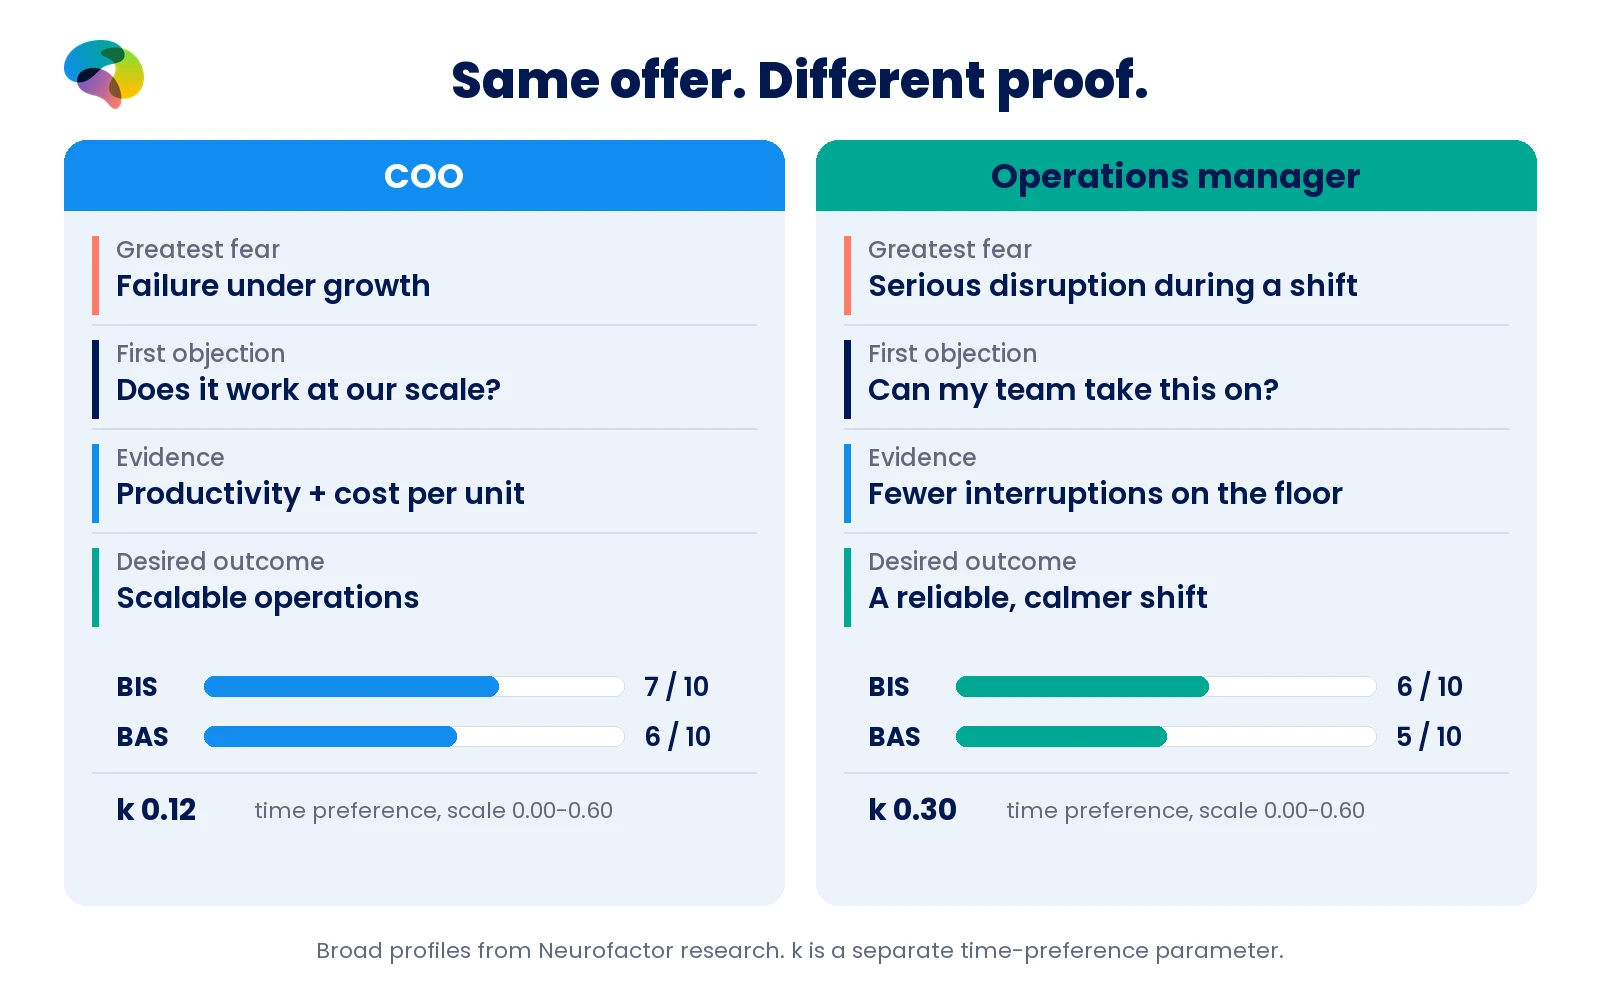
The Neurofactor audience profiles reflect that difference. The COO has BIS 7, BAS 6 and k 0.12; the operations manager has BIS 6, BAS 5 and k 0.30. The COO needs evidence of productivity, repeatability and lasting ownership. The operations manager needs visible fewer disruptions, manageable implementation and proof from a comparable shop floor. Here is what that changes in your pitch, case study, demonstration and follow-up.
The COO asks whether it scales. The operations manager asks about Monday
It is easy to group these two roles under an “efficiency” audience. That usually produces a single message about more output, fewer manual tasks and stronger KPIs. But efficiency answers two different problems. The COO needs an operation that can honour the customer promise during growth. The operations manager is accountable when a shift falls short, a machine stops or staffing collapses.
Even a convincing productivity claim can trigger resistance if the change itself creates risk. The COO wants results that hold beyond one site. The operations manager wants proof the already stretched team can absorb the change. The right product with the wrong first piece of evidence can sound like the wrong investment.
What the source profiles say about the buying decision
| Source characteristic | COO | Operations manager |
|---|---|---|
| Responsibility | Whole operation, quality, cost and delivery of strategy | Daily operation, shift planning, team and departmental KPIs |
| Primary pain | Operations do not scale and cost too much per unit | Continuous firefighting prevents lasting improvement |
| Root cause | Fragmented processes and systems built department by department | Staff shortages, ageing tools and dependence on a few experienced people |
| Emotional driver | Control, results and delivery on customer commitments | Calm, recognition and a team able to resolve problems |
| Greatest fear | Failure during growth or a change that disrupts execution | A serious disruption under their own responsibility |
| First objection | Has it worked at our scale? Unit costs? Who owns implementation? | No time, team already stretched, will it fit our floor? |
| Evidence needed | Sector cases with output, unit costs and COO references | Visible shop-floor improvements and peer-manager references |
| Preferred route | COO network and industry events, followed by business-case meeting | Recommendation from peer or supplier, followed by on-site demo |
| Desired outcome | Reliable scaling at lower cost per unit | Calmer shifts, fewer interruptions and time to improve |
The consequences of failure are located in different places
If the COO deploys a programme across several sites and it does not scale, the company faces a broad execution problem. Costs increase, service deteriorates and leadership must explain why an improvement initiative weakened delivery. This is why the profile explicitly asks who will embed the change in operational management.
For the operations manager, the consequence is immediate and local. New training, an additional manual step or a fragile integration falls on people already stretched by absence and staffing gaps. A failure can stop the day. They are not more or less committed to quality; the losses they must personally manage are different.
For the COO, prove productivity per unit and repeatability
The COO profile centres on an operation that cannot keep pace with ambition and costs too much per unit. Meaningful metrics might include throughput, first-time-right quality, OEE and rework costs. These metrics are not interchangeable. Choose the ones connected to the customer commitment and cost structure.
A strong case establishes a baseline, demonstrates measured improvement and shows how results will be sustained across departments. The source profile mentions failed lean programmes without lasting adoption and consultants who disappeared after presenting. That makes a clear ownership model, rollout sequence and accountability just as important as the potential return.
For the operations manager, implementation is part of the benefit
The operations manager does not lack ideas for improvement. According to the source card, repeated incidents, staff shortages and unfit systems leave little capacity to act. A solution that eventually saves time may be unacceptable if it first requires a difficult migration, extra tasks or extensive training.
Show the actual change on the floor. Who has to do what, how long is training, who provides support and what happens if a shift cannot use the new process? Then measure a relevant outcome: unexpected downtime, rework or handover delays. Visible results in a similar department and peer references are explicitly part of the source profile.
BIS, BAS and k add a second layer of understanding
| Parameter | COO | Operations manager |
|---|---|---|
| BIS - profile scale 0-10 | 7 - alert to disruption of execution | 6 - alert to extra workload and incidents |
| BAS - profile scale 0-10 | 6 - opportunities in productivity and scaling | 5 - opportunities in easier daily work |
| Delay-discount-rate k - separate parameter | 0.12 - longer horizon, annual plans and programmes | 0.30 - greater relative weight on earlier results and fewer interruptions soon |
BIS and BAS are separate 0-10 profile scales. The k parameter is neither a percentage nor a conversion probability. It describes a relative preference for earlier versus later outcomes within the model. None of these values predicts the decisions of an individual person. They support the distinctions already present in the source-card pains, fears and evidence requirements.
Different horizons do not imply that one role is impatient
The COO has k 0.12; the operations manager has k 0.30. In these profiles, this fits annual investment and improvement programmes for the COO and a strong need to reduce interruptions during the current working week for the operations manager. This does not mean the COO rejects early results or the operations manager has no strategic view.
Structure a rollout to serve both horizons. The operations manager should see a meaningful early result without excessive workload. The COO should see how the test can become a controlled, repeatable programme with measured cost and quality outcomes.
Both fear disruption, but ask different questions about it
Consider a system that distributes staffing and capacity more intelligently. The COO asks whether it remains reliable across six sites during peak demand and helps reduce total cost per order. The operations manager asks whether tomorrow’s late shift will still know which tasks come first if a colleague calls in sick.
Both need contingency planning and support. But lead with repeatability and governance for the COO and with understandable steps, shift resilience and hands-on support for the operations manager. The order matters because attention follows responsibility.
Evidence for the COO is not evidence for the shop floor
For the COO, open with a relevant sector case showing baseline, productivity, quality, cost per unit and implementation approach. Add how the result was embedded in operations and, ideally, a peer COO reference. For the operations manager, start with a concrete shift or workflow before and after implementation. Show reduced interruptions and how little strain adoption placed on the team.
A product demo proves a feature works in a demo. A site trial can show it works in one environment. Only a carefully supported rollout case can justify broader repeatability. Do not quietly turn one of those statements into another.
A first objection reveals the missing evidence
“Has this worked at our scale?” asks whether the COO can responsibly roll out the solution, not whether they dislike innovation. “We have no time” often means the operations manager lacks the staffing capacity to absorb another initiative. The profiles explicitly link that objection to a stretched team.
For the COO, add scalable cases, unit economics and a plan for ownership. For the operations manager, show a low-burden trial, on-site support, simple recovery options and proof from a comparable department. More feature slides will not resolve either problem.
Seven things to change in your outreach and demonstration
Keep the same honest product claims while changing the first question and the first evidence.
- Start the COO conversation with scale: what constrains growth and what is the cost per unit?
- Start the operations-manager conversation with the next shift: which interruption consumes the most time?
- Bring two case views: operational results across sites and a credible floor-level workflow.
- Show the implementation burden: training, fallback, support and interruption risk.
- Connect measurements: how does less downtime at one site translate into repeatable productivity?
- Check decision rights: the job title alone does not establish budget or approval authority.
- Follow up differently: share a scalable business case with the COO and an easy trial plan with the operations manager.
One planning platform, two immediate questions
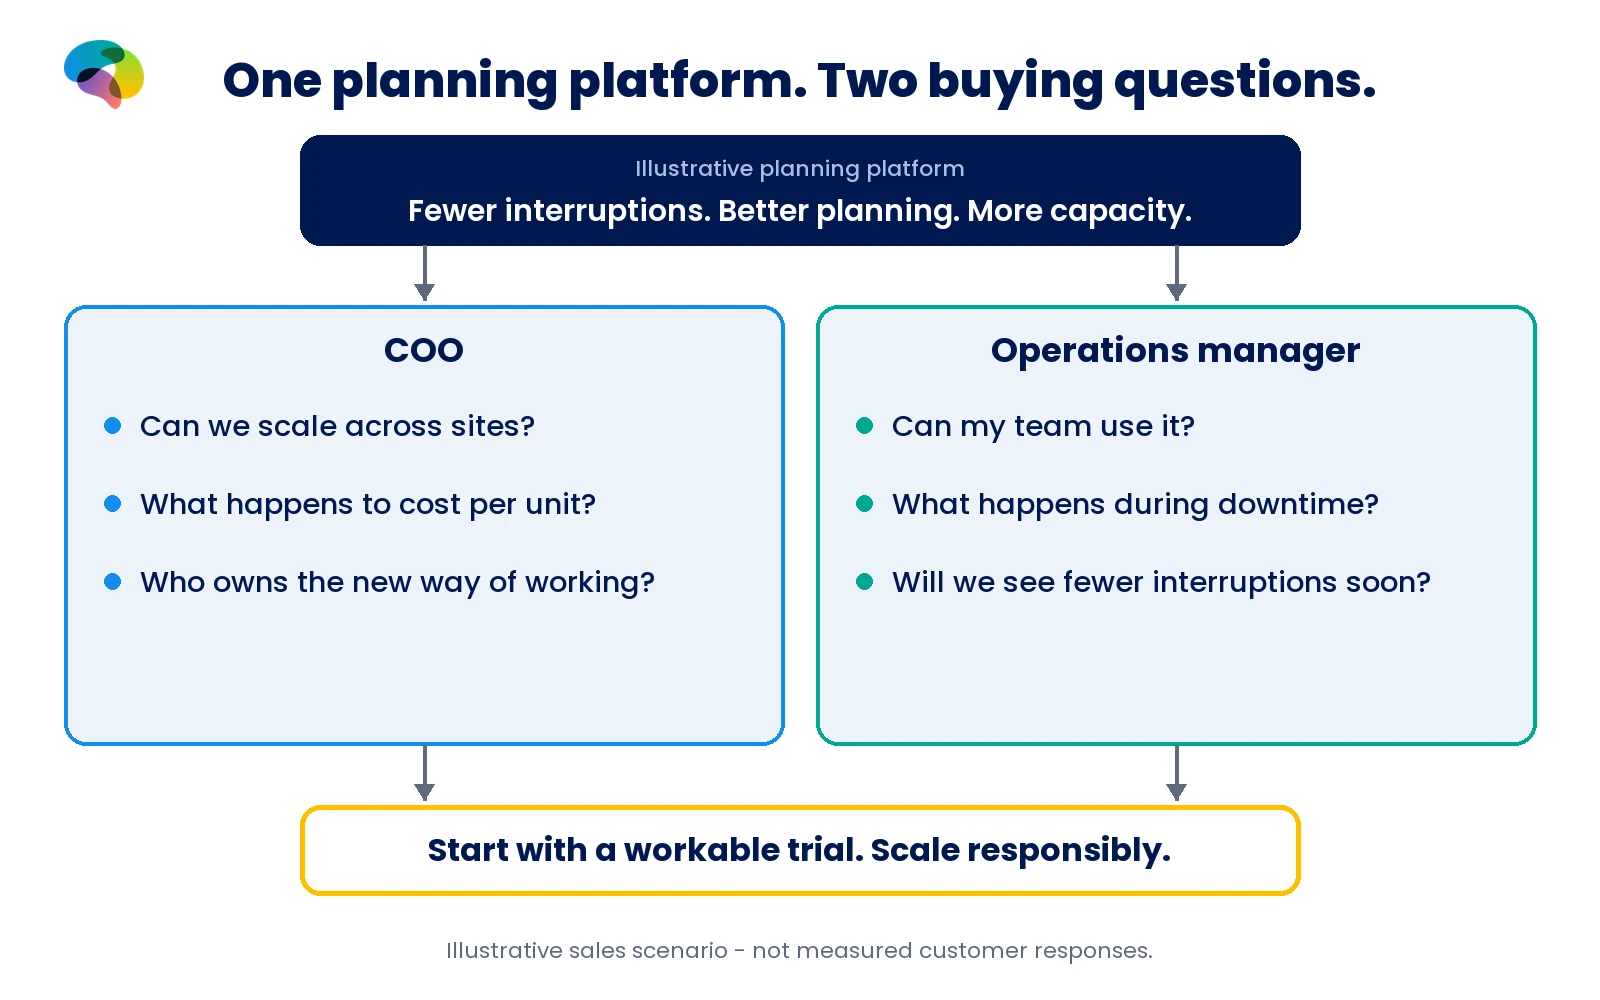
Illustrative scenario, not a measured customer response. You sell a platform that coordinates staffing and capacity across locations: “Fewer interruptions, better planning and more output with the same resources.”
The operations manager asks how long planners need to learn it, what happens during downtime and whether the team will notice fewer rota problems next week. The COO asks how rollout across locations works, whether cost per order falls and who keeps the process embedded after launch.
The appropriate first demonstration shows a real shift and a manageable trial. The strategic follow-up separates what the trial demonstrates from what still requires validation at scale. It includes the cost, ownership and risk of rollout.
Two opening messages for the same offer
To the COO: “As sites grow, inconsistent planning can make unit costs and service quality harder to control. I can share a case showing measurable capacity improvements and how operational leaders kept the process in place. Which KPI would show you that the change really scales?”
To the operations manager: “If staffing changes and last-minute requests keep disrupting the plan, a new tool only helps if it creates less work. I can show a short demonstration from a comparable team, including training and support. Which disruption would you most like to remove first?”
Neither message claims outcomes that have not been established. Each invites a discussion about a problem supported by the relevant source profile.
When both roles influence the same purchase
The operations manager may know whether the process genuinely works for the people using it; the COO may need to decide whether the improvement matters across the business. But a job title is not a formal mandate map. An operations manager may control a departmental budget, and a COO may still need finance or board approval.
Create a shared measurement plan for early reliability, team load, disruption risk, quality and cost per unit. State who collects each metric, over which period and what else might explain the change. This allows an operational trial to become defensible evidence rather than a win for one stakeholder.
Broad research-informed profiles are not individual mind-reading
These profiles reflect recurring patterns from Neurofactor studies conducted over several years with these and comparable audiences. They are therefore grounded broad role profiles, not personality readings of every COO or operations manager. Sector, company size, safety requirements, price, proposition, authority and the specific decision context can shift which concerns matter most.
To make the profile useful for your offer, connect it to a target group profile and an association map. This helps identify the associations, objections and evidence your particular product activates. Product-specific work refines the existing research rather than dismissing it.
Want to know how COOs and operations managers view your product or service? Contact Neurofactor and have the broad profile translated into your proposition.
How to adapt these patterns to your actual product
First define exactly what your product changes: planning, maintenance, safety, capacity, staffing or something else. Identify who experiences the problem and who must approve the investment. Then explore associations around the current process, the proposed change and the feared downside.
Ask the COO which scaling claim is relevant, what return threshold matters and who would own the new process. Ask the operations manager which step creates the most friction, what training burden is realistic and which proof would be credible to the team. Turn the answers into one evidence architecture: a small, dependable test that could responsibly be expanded. Link the output to a tailored communication strategy.
The COO must be able to scale what the operations manager can safely implement
The mistake is not promising efficiency. The mistake is assuming efficiency means the same kind of proof at every level of operations. The operations manager needs confidence the next working day will run better without crushing the team. The COO needs confidence that the improvement can survive growth and appear in operational unit economics.
A strong B2B business case connects the immediate operational proof to the organisation-wide consequence. Start with what people can actually deliver, not a generic claim of productivity.
Key terms
- COO
- Chief Operating Officer: executive accountable for operations, productivity, quality and the execution of strategy.
- Operations manager
- Leader responsible for the flow, staffing and KPIs of daily operations or an operational department.
- BIS
- Behavioral Inhibition System: a profile parameter reflecting attention to risk, possible disruption and loss.
- BAS
- Behavioral Activation System: a profile parameter reflecting orientation towards opportunity and desirable outcomes.
- Delay-discount-rate k
- A parameter describing the relative valuation of earlier versus later outcomes; not a percentage or purchase probability.
- Cost per unit
- Relevant operational costs divided by the produced or delivered units, with a clear measurement scope.
- Operational embedding
- Ownership, routines and governance that keep an improvement working after the pilot.
- Target group profile
- Research-grounded picture of a group’s motives, barriers and evidence needs, to be refined for a particular offer.
- Association map
- A representation of meanings and associations an audience connects with brands, ideas or propositions.
- Proof of concept
- A bounded test of whether a solution works under agreed conditions; it does not itself prove scalability.
Frequently asked questions
What is the main buying difference between a COO and an operations manager?
The COO evaluates scalable productivity, unit economics and durable governance across the operation. The operations manager evaluates daily interruptions, staff workload and feasibility on the floor. The same product therefore needs different initial evidence.
What are their BIS, BAS and k values in the Neurofactor profiles?
COO: BIS 7, BAS 6 and k 0.12. Operations manager: BIS 6, BAS 5 and k 0.30. These are broad research-informed role-profile parameters, not individual scores or buying probabilities.
What evidence is useful to a COO?
Comparable sector cases with productivity and cost-per-unit results, a workable scaling and ownership plan, and preferably references from peer COOs.
What evidence is useful to an operations manager?
A shop-floor demo or low-burden trial, fewer interruptions shown in a comparable department, reliable implementation support and peer-manager references.
Does the higher k value mean an operations manager always buys faster?
No. k concerns the relative valuation of sooner versus later outcomes. It is not a forecast of purchasing speed or authority. Budget, company and product context still matter.
How should I adapt the profiles to my specific offer?
Identify the relevant buyers and decision rights, then use a target group profile and association map to understand the particular risks, benefits and evidence activated by your product or service.
Sources
- 1.Neurofactor_Sitemap_Master_Blogserie_39_2026-10-05(2).xlsx; tabblad Blogserie_LinkedIn_Doelgroepen; record NF-BLOG-LI-OPS-01 - Neurofactor (2026-10)
- 2.Carver & White (1994), Behavioral Inhibition, Behavioral Activation, and Affective Responses to Impending Reward and Punishment - Journal of Personality and Social Psychology (1994)
- 3.Frederick, Loewenstein & O'Donoghue (2002), Time Discounting and Time Preference: A Critical Review - Journal of Economic Literature (2002)
This series
Who are you really selling to?Category synthesis
Operations does not buy promises. Operations buys predictabilityRead next
Related topics
Reviewed by: Martijn den Otter · Last reviewed: 10/11/2026
Martijn den Otter
Oprichter van Neurofactor. Expert in neuromarketing en consumentenpsychologie.
LinkedIn →