
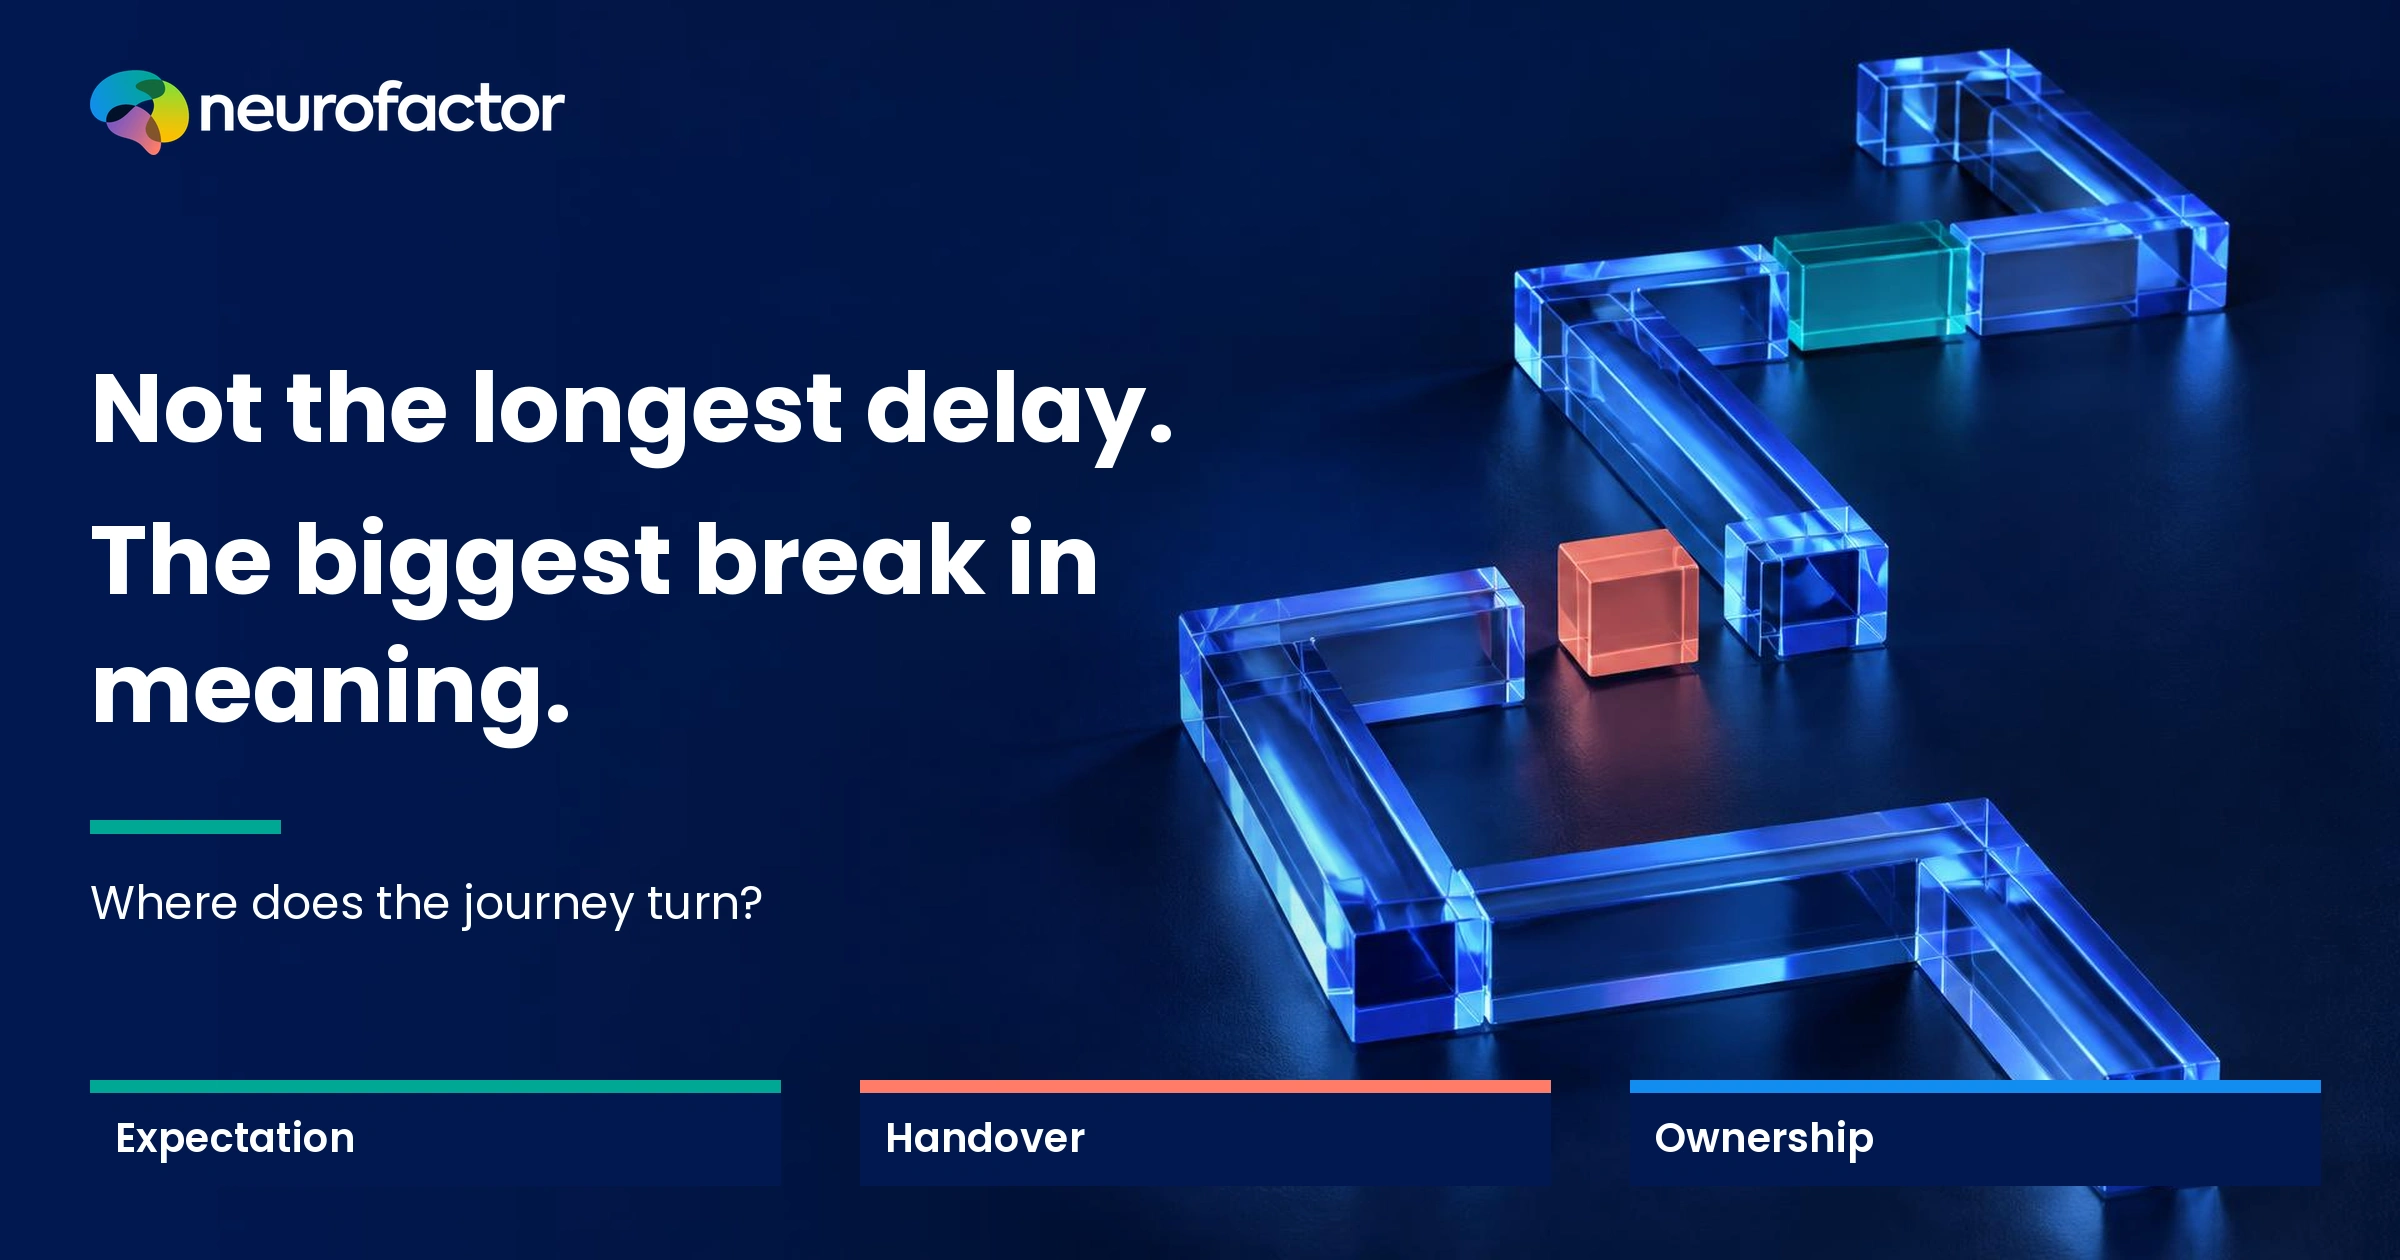
Where does friction in a customer journey turn into distrust?
The worst moment in a customer journey is not necessarily the longest wait or the most complicated task. The strongest negative associations often emerge when an experience violates an important expectation and acquires a meaning such as 'they don't listen', 'I have lost control' or 'their promise was not real'. The moment at which this happens differs across audiences and contexts. This is why a journey should not be evaluated through waiting times, error logs and satisfaction alone. For each relevant touchpoint, investigate what association is activated, how strongly it is experienced, what preceded it and what happens afterwards. Only then can you decide whether to improve the waiting time, the information, the handover, the customer's control or the actual service. [S01] [S03] [S04]
The hardest task is not always the most damaging moment.
A visitor spends ten minutes waiting outside an entrance. The cause is clear, the queue moves and the booking still has a valid arrival window. Annoying, perhaps. Then a member of staff says the reservation cannot be found, without explaining what will happen next. That conversation lasts thirty seconds, but it may colour the whole visit.
Organisations often search for the longest queue, the most clicks or the highest complaint volume. All three are useful indicators. None is direct evidence of the association the visitor attaches to the organisation. A queue may signal 'busy but organised'. A brief, confusing exchange may communicate 'unreliable'. The negative meaning does not reside exclusively in the event itself. It is created through the visitor's interpretation of the event.
Our central question is therefore different: at what point in this particular journey does a touchpoint change what the brand, service or experience means? How can we demonstrate that, rather than treating one person's annoyance as proof of a universal customer pattern? [S01] [S02]
A touchpoint, an emotion and an association are different things.
A conventional journey map records actions. Association research needs another layer: what does this event suggest the organisation is, or what does it mean for this person? This distinction separates a minor usability fix from a problem with perceived trustworthiness.
These measures should be kept separate. A low satisfaction rating is not automatically a strong negative association. Equally, a respectable overall rating does not mean that an important association has not deteriorated.
Touchpoint
- Example
- Queue at the entrance
- What it tells you
- Where an experience happens
- What it does not yet establish
- That waiting feels negative
Event
- Example
- Reservation cannot be located
- What it tells you
- Where friction occurs
- What it does not yet establish
- The meaning assigned to it
Emotion
- Example
- Frustration or anxiety
- What it tells you
- An immediate affective reaction
- What it does not yet establish
- A durable brand association
Association
- Example
- 'Nobody takes ownership here'
- What it tells you
- Interpreted organisational meaning
- What it does not yet establish
- That all visitors think this
Consequence
- Example
- Ask, abandon, complain or return
- What it tells you
- Observable next behaviour
- What it does not yet establish
- That the event caused the behaviour
Negative meaning grows when promise and reality collide.
Imagine a company describes its experience as 'effortless'. The visitor now has a reference point for everything that follows. A slightly awkward payment form may be a nuisance. But if the confirmation then disappears and the same information must be provided three times, the experience can start to suggest 'they don't have things under control'. The gap between promise and reality changes the message the friction sends.
Oliver examined expectations and the confirmation or disconfirmation of expectations in satisfaction judgements. Zeithaml, Berry and Parasuraman distinguished desired, adequate and predicted service. Their findings do not identify one universally worst customer touchpoint, but they explain why an identical event can be interpreted very differently by different visitors. [S03] [S04]
That produces a practical rule: do not automatically try to remove every unpleasant moment. First establish the expectation that matters, how it arose and why the experience contradicted it. Sometimes the promise is exaggerated. Sometimes delivery is defective. Often it is necessary to examine both.
The journey begins before the customer arrives.
Associations can form in a search result, an advert, a recommendation or the booking confirmation. 'Personal guidance' creates a different expectation from 'manage everything yourself in seconds'. Before anyone enters a building or opens an app, they may already have formed assumptions about speed, competence, price transparency, reassurance and personal freedom.
This preparatory stage is easy to omit from journey analysis because it occurs outside the organisation's premises. Yet the on-site experience cannot be understood without knowing what the customer expected to find. For one audience a staff member who explains everything may signal care; for another that same explanation may feel like a restriction on control. Neither reaction can safely be predicted from age or educational background alone.
Record the entry context. Where did visitors first encounter the offer? What did they think would happen? Which promises had they already seen? Which words stuck in their memory? A measurement taken during a visit is far less informative without the expectation that preceded it. [S01] [S02]
Waiting can become harmful when uncertainty replaces progress.
Waiting is not a single psychological state. A queue might signify healthy demand or ordinary congestion, but it might also signal disrespect, incompetence or a sense that the customer's time does not matter. The clock cannot determine which association dominates. That also depends on predictability, visible progress, an explanation of the delay and the customer's ability to make a choice.
Compare two situations. In the first, a realistic waiting estimate is displayed and updated when circumstances change. In the second, a desk is empty, no information arrives and visitors are not even sure they are waiting in the right place. Both situations may last exactly the same time. That does not prove that the second must create more stress for every individual, but it gives researchers a precise hypothesis to test.
A design question such as 'How can we shorten the queue?' is incomplete. Add 'What do customers think the delay means, and what truthful information would help them interpret it accurately?' [S04] [S09]
The handover is an underestimated fault line.
The first employee was helpful. The second knows nothing about the issue. The visitor repeats the story, shows the confirmation again and has to determine who will own the next step. Each isolated encounter may have been polite. The overall experience nevertheless becomes less reliable.
The negative association often forms between departments, channels and systems, where no single team's dashboard can see it. A booking platform reports a successful transaction; the front desk reports an answered question; customer support reports a closed ticket. The customer remembers, 'I was the only person holding the whole process together'. This is the gap between a process dashboard and an experienced journey.
Lemon and Verhoef describe journeys as sequences across touchpoints and channels. Rawson, Duncan and Jones argue that strong performance on individual touchpoints can obscure a weak end-to-end experience. The latter is a practitioner publication rather than experimental evidence of an invariant effect. [S01] [S11]
The response to a failure may matter as much as the failure.
An error need not destroy trust. An employee may acknowledge the problem, explain the recovery process and make the next step verifiable. Conversely, arguments about responsibility, unrealistic promises and opaque procedures can turn a practical mistake into a judgement that the organisation does not take the customer seriously.
Tax, Brown and Chandrashekaran found that complaint handling is evaluated in terms of outcomes, procedures and interpersonal treatment. Bitner studied how physical surroundings and employee responses relate to evaluations after service failures. These studies do not prove that every apology works or that compensation is always the right response. [S08] [S09]
Investigate three dimensions at each recovery moment: what outcome did the person receive, was the route to that outcome fair and comprehensible, and how were they treated? With a technical failure, procedural fairness may be especially relevant. In a sensitive encounter, respectful communication may also carry considerable weight. The specific pattern still needs testing in context.
Eight potential friction points across one journey.
This matrix is a guide to research questions, not a ranking or a set of measured Neurofactor scores. All associations shown are illustrative hypotheses.
In internal workshops, participants often identify one favourite candidate for 'the worst point'. The matrix requires teams to name the proposed meaning and an actual measurement before declaring that point the winner.
Discovery
- Potential friction
- Vague promise and price
- Possible negative association
- 'There is a catch'
- Measure separately
- Expectation and trust
- First design question
- What can be verified in advance?
Booking
- Potential friction
- Too many steps, unclear confirmation
- Possible negative association
- 'This is complicated'
- Measure separately
- Completion and uncertainty
- First design question
- Is the process understandable?
Arrival
- Potential friction
- Confusing route or entrance
- Possible negative association
- 'This place is not for me'
- Measure separately
- Search time and interpretation
- First design question
- Which cue is missing?
Waiting
- Potential friction
- Silence about progress
- Possible negative association
- 'My time is irrelevant'
- Measure separately
- Duration, valence and control
- First design question
- What can be explained honestly?
Handover
- Potential friction
- Providing the same details again
- Possible negative association
- 'Nobody owns this problem'
- Measure separately
- Repetition and ownership
- First design question
- Who holds the journey together?
Delivery
- Potential friction
- The service differs from its promise
- Possible negative association
- 'They misled me'
- Measure separately
- Expectation gap
- First design question
- Is the promise or delivery wrong?
Payment
- Potential friction
- Unexpected conditions or charges
- Possible negative association
- 'They are not transparent'
- Measure separately
- Understanding and surprise
- First design question
- What information arrived too late?
Aftercare
- Potential friction
- Silence or defensive replies
- Possible negative association
- 'They abandon me afterwards'
- Measure separately
- Response and recovery
- First design question
- Which commitment remains unmet?
Valence, intensity, memory and behaviour are four outcomes.
'Where is the customer experience worst?' sounds like one question. It contains at least four. Which event feels most negative as it happens? Which event produces the most damaging interpretation of the organisation? What remains prominent in memory later? And which moment is associated with abandonment, a complaint or a decision not to return?
Those results can overlap, but they are not interchangeable. A startling noise may produce a brief unpleasant reaction while the overall visit is remembered positively. Repeated ambiguity in an invoice process may produce little drama but gradually suggest unreliability. The intensity of an isolated reaction is not, by itself, a reliable forecast of loyalty.
We use affective valence for the positive or negative quality of an experience, and association for the meaning attributed to an organisation. Neurofactor explains the first concept in its knowledge-base article on affective valence. When setting priorities, report valence, intensity, recurrence, memory and behavioural evidence separately. [S05] [S06]
Why a bad ending can colour memory without explaining everything.
The peak-end idea has an empirical foundation. Fredrickson and Kahneman studied retrospective evaluations of affective experiences, while Kahneman and colleagues showed a preference pattern involving the ending of an unpleasant experimental episode. These findings make it plausible that pronounced peaks and final moments sometimes carry disproportionate weight in recollection. [S06] [S07]
They do not prove that every service experience follows the same rule across all people and cultures. Nor do they authorise a business to retain a flawed process on the assumption that a cheerful farewell will cancel the damage. A memorable incident is not necessarily the incident that causes changes in future purchasing behaviour.
Separate the experience as it unfolds from what customers report the next day or week. The difference is informative. But the case for redesign still needs behavioural evidence and an assessment of the underlying service obligation.
One touchpoint can mean different things to different groups.
Consider a self-service check-in kiosk. A visitor who values speed and independence may see it as convenient. A first-time visitor who needs support may interpret the same kiosk as 'nobody is available to help'. Do not infer that need from someone's age, appearance or presumed ability. The risk often comes from a lack of accessible alternatives, not from the technology's mere existence.
Useful groups emerge from researched differences in needs, circumstances and associations: first versus repeat visits, time pressure, task purpose and accessibility needs. People within those groups can still disagree. A segment is a starting point for studying context, not a permanent label for a person.
Avoid constructing a single average emotion curve and calling it 'the customer'. Compare relevant journeys and expose variation. A severe problem affecting a smaller group may need urgent action even if it barely moves a population average. [S10]
Fictional case: a booking problem at an experience centre.
This is an entirely fictional case. It is not a Neurofactor client project, research dataset or report about an actual venue. An experience centre promises 'an effortless visit designed around you'. Mira books two tickets and receives a confirmation. On Saturday she arrives with her father. A parking sign points towards an outdated entrance; a polite employee directs them elsewhere. Five minutes are lost.
At reception the QR code does not load. The employee asks Mira to find the original confirmation again. Her father waits in a crowded lobby. A second employee eventually explains that the booking is probably in another system. Nobody says how long verification will take, who is responsible, or whether their reserved slot is still secure.
The guided experience itself is excellent. Yet Mira later recalls, 'I enjoyed it, but for a moment I didn't know whether we were even welcome'. The team might identify the failed QR code as the main issue. For Mira, the crucial point may instead be the moment nobody took ownership of her uncertainty. That is a hypothesis to investigate, not an observed study result.
One fictional journey, three competing diagnoses.
The same sequence could support different improvements, depending on what research actually finds.
A manager who only tracks average handling time can miss these differences. A manager who only measures emotion will still lack an explanation of which process should change. A useful diagnosis links the event, the association and the plausible source of the problem.
'I couldn't locate the entrance'
- Underlying problem
- Wayfinding and arrival confidence
- Avoid doing first
- New welcome campaign
- Investigate first
- Signs and the first route decision
'I didn't know whether we would get in'
- Underlying problem
- Uncertainty and lost control
- Avoid doing first
- Only optimise QR loading speed
- Investigate first
- Status information, fallback and ownership
'I had to prove my booking repeatedly'
- Underlying problem
- Perceived mistrust and repeated handovers
- Avoid doing first
- Add more instructions
- Investigate first
- One shared case record and error acknowledgment
Eight research steps from complete journey to critical moment.
1. Define one journey. For example, from confirmation email to the moment after departure. Include parking, external booking tools and follow-up messages.
2. Map the promises. Gather advertising, booking screens, confirmation messages, conditions and staff scripts. Establish where expectations were created.
3. Select relevant contexts. Compare first and repeat visits, visitor goals, congestion and accessibility requirements where appropriate. Avoid stereotype-based segmentation.
4. Record actual behaviour. Capture event times, wrong turns, failed tasks, requests for help, repeated explanations and handovers. Apply proportionate privacy safeguards and appropriate permissions.
5. Capture meaning near the moment. Ask a brief open question and use compact, pre-defined valence or perceived-control measures at selected touchpoints. The research should not unnecessarily disrupt the experience.
6. Assess later memory. Ask what stood out, which moment changed the person's view of the organisation and why. Compare this with contemporaneous observations.
7. Test alternative explanations. Examine crowding, prior experiences, communication failures, system behaviour and sources of associations outside the touchpoint itself.
8. Test a specific improvement. State the expected change in meaning in advance, then repeat the relevant measurements. This eight-step sequence is an editorial research design, not an independently validated proprietary scale. [S01] [S10] [S13]
Select measurement tools for the question they can answer.
There is no single instrument that reveals which moment caused the strongest negative association. Each method provides a different kind of evidence.
Neurofactor's pages on EEG in experience research and real-world neuroscience explain the relevant measurement environments. Fazio and Olson reviewed the interpretation and validity limitations of indirect measures. Combining tools can be useful, but more sensors do not automatically increase validity. [S13]
Observation, task logs and timestamps
- Particularly useful for
- Searching, stopping and needing help
- What cannot safely be inferred
- Precisely why it felt that way
Short open interview near the event
- Particularly useful for
- Meaning expressed in the customer's words
- What cannot safely be inferred
- That everyone shares this interpretation
Momentary ratings and experience diaries
- Particularly useful for
- Valence, expectations and change over time
- What cannot safely be inferred
- An established causal mechanism
Later interview or follow-up
- Particularly useful for
- What is remembered and attributed
- What cannot safely be inferred
- The exact emotion experienced earlier
Eye tracking
- Particularly useful for
- Visual attention and search behaviour
- What cannot safely be inferred
- Understanding, emotion or preference directly
EEG or additional physiology
- Particularly useful for
- Selected time-resolved measures with validated interpretation
- What cannot safely be inferred
- Mind reading or a unique emotion label
Implicit association task
- Particularly useful for
- Relative associations in a suitable validated design
- What cannot safely be inferred
- An individual truth or purchase prediction
What makes a credible study in a real environment?
Reliable timing matters. Suppose a visitor takes a wrong turn, meets a staff member and then watches an engaging presentation. A researcher needs to know which recording belongs to which event. Observational markers should describe actions, not just broad zones: 'wrong turn selected', 'help requested' and 'alternative route confirmed' are more informative than 'entrance'.
If EEG or other physiological measures are suitable, signal quality and an appropriate baseline become important. Movement artefacts, individual differences and the equipment's own influence on behaviour complicate interpretation. A distinctive signal is not automatically evidence of 'distrust' or 'frustration'. Those interpretations require defensible operational definitions, converging observations and attention to alternatives.
Design from the decision backwards. If the aim is to compare two signs, a robust wayfinding observation may be more useful than an elaborate physiological recording. If the aim is to study reactions over time, synchronisation and event definition must be reliable before interpreting any curve. [S01] [S13]
Do not reduce the strongest negative association to one number.
A heatmap with large red circles looks convincing, but what exactly does red represent? How many visitors reported a negative moment? The mean valence rating? The relative strength of a specific association? The length of a delay? Or a relationship with subsequent abandonment? These quantities cannot simply be treated as one scale.
For each touchpoint, report at least the frequency of exposure, the nature of the association, the intensity and uncertainty of the measure, relevant subsequent behaviour, and variation across groups. Distinguish spontaneous associations from responses selected from a list. A two-point difference on a home-made scale is not meaningful without evidence about its reliability and interpretation.
A prioritisation matrix can then combine promise relevance, exposure, possible behavioural consequences, tractability and the seriousness of the barrier. Safety and accessibility deserve independent criteria. Such a matrix is a transparent management judgement, not a scientifically validated 'neural damage index'.
Match the intervention to the actual association.
If the message is 'they keep me in the dark': provide a truthful progress estimate and a clear alternative when the original promise cannot be met. Test whether visitors understand the information.
If it is 'I have to solve everything myself': assign an accountable contact for the complete problem, even when the technical solution depends on another team. Track the number of times people repeat information. [S12]
If it is 'I do not feel welcome here': investigate where that experience starts. Consider the entrance, approachability, accessibility, noise, navigation and interpersonal treatment. A friendlier script cannot compensate for structural exclusion.
If it is 'this is not what was promised': repair the promise or the delivery, not just the wording. Marketing, operations and customer support should agree on what is genuinely deliverable.
If it is 'they treat me unfairly': improve the outcome and the clarity of the procedure. Make decision rules, reasons and recovery options understandable. [S03] [S08] [S09]
The same error with two different recovery responses.
Return to the fictional booking failure. In version A an employee says, 'It is a system issue. Could you show your email again?' The customer waits, gets transferred and eventually enters. From an operational perspective the booking was resolved.
In version B the employee says, 'I can see your confirmation. We will sort this out. I am your contact, and I will give you an update within five minutes even if the booking has not yet been located.' The employee investigates, offers a suitable waiting space and explains whether the reserved slot is protected. The system failure remains, but the procedure offers greater clarity and ownership.
This is not an A/B test with real results. It is a pair of competing intervention hypotheses. Compare comprehension, perceived fairness, uncertainty, task completion and follow-up complaints. If version B cannot provide a workable resolution, nicer wording will not fix the underlying failure.
The ending, the memory and the next decision.
What does a customer remember afterwards? A visit can be largely positive and still be overshadowed by one incident; an awkward beginning may also be followed by a good recovery. Research on remembered affective episodes explains why retrospective reports need not correspond to the arithmetic average of every moment. [S06] [S07]
There is also an important caution. In a meta-analysis, De Matos, Henrique and Rossi found mixed support for the service recovery paradox: the cumulative effect on satisfaction was positive, but effects on repurchase intentions, word of mouth and corporate image were not statistically significant. Exceptional recovery does not justify allowing preventable failures to persist. [S14]
At follow-up, distinguish recall, satisfaction with the resolution and actual next behaviour. Did the customer return? Recommend the experience? Reopen the complaint? Otherwise a well-managed farewell may be misrepresented as evidence of lasting loyalty.
How can we know the redesign actually worked?
An organisation installs new wayfinding signs and sees fewer complaints. Does this prove the solution worked? Not necessarily. Staffing may have changed, congestion may have eased or the mix of visitors may differ. Complaints may even fall because it has become harder to complain. One improved metric is not sufficient evidence of causality.
Choose one primary outcome based on the problem. For route uncertainty, that could be the proportion of first-time visitors reaching a destination unaided. For handover failures, the number of repeated explanations per case. For perceived injustice, a clearly specified fairness measure plus open accounts. Include affective and association outcomes, but do not conflate them with completed behaviour.
Where feasible, compare against a suitable control condition or phased rollout. Document time periods, sample sizes, selection bias and operational variation. Report whether findings are exploratory. Strong research must allow a manager's preferred idea to fail the test.
The limits of EEG, eye tracking and indirect association tasks.
Neurofactor can study experiences using several kinds of evidence. This opens interesting possibilities but requires disciplined claims. EEG measures electrical activity at the scalp; without a carefully validated operationalisation it cannot reveal the exact thought in someone's mind. Eye tracking records gaze rather than comprehension or intention. An indirect association task yields a context- and task-dependent result, not a personal lie detector.
Physiological changes can reflect multiple processes, including attention, effort, movement and affect. Colourful curves cannot therefore be translated directly into 'the entrance caused distrust'. Combine recordings with behavioural observation, explicit reports and contextual evidence. Investigate rival explanations. Fazio and Olson outline why implicit measures require careful interpretation. [S13]
The associations discussed here are research questions, not Neurofactor's unpublished effect estimates. We make no claim about results from the Mauritshuis or other clients, no secret customer emotion readings and no universal neurological tipping point. The framework is intended for testable diagnosis and service design.
Accessibility and vulnerability must influence priority.
A relatively small set of visitors may encounter a serious barrier that barely affects the average score. A person with limited mobility cannot always correct a wrong route. Someone sensitive to sensory overload may struggle with a crowded waiting area. Another customer may be unable to complete the digital booking process without assistance. Such problems require an accessible service first, not better emotional marketing.
Include people with different support needs in journey design. Ask what practical adjustments are required; do not infer needs from appearance, age or presumed health characteristics. Collect only necessary data and use an appropriate legal basis, transparent purpose and secure handling for participant information.
If priorities are determined by volume alone, serious barriers can be pushed to the bottom. Give safety and accessibility their own urgency regardless of aggregate association scores. A broadly positive experience does not excuse an avoidable problem for a smaller group.
Which touchpoints should be redesigned first?
Use an explicit decision table after investigation, not merely an emotional heatmap. The following categories are an editorial planning tool rather than findings from a dataset.
'Not measured' does not mean 'unimportant'. Record the uncertainty behind each decision. A CX team should be able to explain why it repaired the handover before changing the background music.
Safety or accessibility risk
- Diagnosis
- Objective hazard or barrier
- First response
- Address immediately, independent of score
- Evidence needed afterwards
- Functional accessibility retest
Major broken promise
- Diagnosis
- Expectation and delivery diverge
- First response
- Correct the promise or delivery
- Evidence needed afterwards
- Comprehension, trust and real fulfilment
Repeated process friction
- Diagnosis
- Repetition or uncertainty imposed on customer
- First response
- Repair process and ownership
- Evidence needed afterwards
- Fewer failures and repeats, better experience
Salient irritation with unknown behavioural impact
- Diagnosis
- Memorable incident; effect uncertain
- First response
- Targeted hypothesis and additional measurement
- Evidence needed afterwards
- Consistency across times and groups
Weak score without clear explanation
- Diagnosis
- Conflicting or insufficient evidence
- First response
- Investigate before redesign
- Evidence needed afterwards
- Reproducible explanation
Five mistakes that weaken association-based journey research.
1. Treating a satisfaction number as a mental map. A score of six does not disclose what association formed. Ask what happened and what it meant.
2. Assuming every visitor followed the same path. Map the actual routes, abandonment points and external providers before comparing averages.
3. Calling a salient moment causal evidence. Co-occurrence and causation are different. Specify a hypothesis and test a relevant alternative.
4. Fixing language when the promise itself is false. Better copy cannot repair a broken agreement, inaccessible entrance or opaque charge.
5. Prioritising the sensor over the decision. The research question selects the method. Clear observations and carefully worded answers may contribute more than unvalidated additional measurements.
The aim is not to eliminate every uncomfortable feeling. Meaningful experiences sometimes involve effort, uncertainty or excitement. The aim is to discover avoidable friction and distorted expectations, then demonstrate that the chosen improvement makes a meaningful difference.
Conclusion - find the moment meaning breaks, not just the reddest point.
A customer journey is not the sum of pleasant and unpleasant minutes. A negative association matters when an event changes what someone expects, thinks or believes about an organisation. That may happen during arrival, waiting, a handover, an unexpected payment or the recovery from a failure. Its location and intensity cannot responsibly be assumed in advance.
The best CX decision starts not with the lowest score, but with the moment an important expectation breaks and the reason behind it. By studying the event, association, audience and subsequent behaviour together, you can distinguish a process that needs repairing from a promise that needs correcting and an experience that needs redesigning. That is how a customer journey becomes a basis for accountable decisions instead of a decorative heatmap.
Key terms
- Customer journey
- The sequence of experiences and touchpoints before, during and after an interaction or decision.
- Touchpoint
- A particular interaction between a person and an organisation, channel, staff member or environment.
- Negative association
- An unfavourable meaning that someone links to a brand, organisation or experience within a context.
- Affective valence
- The positive or negative quality of a feeling or experience.
- Meaning rupture
- A descriptive term in this article for a moment that breaks an important expectation; not a validated independent scale.
- Expectation disconfirmation
- The discrepancy between what someone expects and what is subsequently experienced.
- Service recovery
- The response by which an organisation acknowledges and attempts to remedy a service failure.
- Momentary measure
- A measurement linked to a particular moment, complementing later memory-based accounts.
Frequently asked questions
Where do the strongest negative customer journey associations arise?
There is no universal touchpoint. They can appear when an event breaks an important expectation and suggests lost control, unreliability or disrespect. Investigate meaning and subsequent behaviour within the relevant audience.
Why might a short service conversation matter more than a long wait?
A brief exchange can acquire more harmful meaning if nobody owns the problem or explains what happens next. Waiting time, information and customer context need separate investigation.
How is negative emotion different from a negative association?
An emotion concerns how someone feels at a moment. An association is the meaning attributed to the organisation. They can co-occur but are not interchangeable.
Can EEG measure negative customer associations?
EEG can contribute selected time-resolved physiological information within a defensible design. It does not directly reveal distrust or read thoughts. Interpretation requires additional validated evidence.
Which customer journey touchpoints should be fixed first?
Consider severity, exposure, plausible causes, harmful associations, accessibility and behavioural evidence. Safety and accessibility should not wait for a low average satisfaction score.
Can excellent service recovery cancel an original mistake?
Not reliably. Recovery may improve satisfaction, but research does not support a general gain in repeat purchase, word of mouth or brand image after a failure. Prevent failures where possible.
Sources
- 1.Understanding Customer Experience Throughout the Customer Journey - Journal of Marketing (2016)
- 2.Customer Experience Creation: Determinants, Dynamics and Management Strategies - Journal of Retailing (2009)
- 3.A Cognitive Model of the Antecedents and Consequences of Satisfaction Decisions - Journal of Marketing Research (1980)
- 4.The Nature and Determinants of Customer Expectations of Service - Journal of the Academy of Marketing Science (1993)
- 5.Bad Is Stronger Than Good - Review of General Psychology (2001)
- 6.Duration Neglect in Retrospective Evaluations of Affective Episodes - Journal of Personality and Social Psychology (1993)
- 7.When More Pain Is Preferred to Less: Adding a Better End - Psychological Science (1993)
- 8.Customer Evaluations of Service Complaint Experiences: Implications for Relationship Marketing - Journal of Marketing (1998)
- 9.Evaluating Service Encounters: The Effects of Physical Surroundings and Employee Responses - Journal of Marketing (1990)
- 10.How to Create a Realistic Customer Journey Map - Business Horizons (2017)
- 11.The Truth About Customer Experience - Harvard Business Review (2013)
- 12.Stop Trying to Delight Your Customers - Harvard Business Review (2010)
- 13.Implicit Measures in Social Cognition Research: Their Meaning and Use - Annual Review of Psychology (2003)
- 14.Service Recovery Paradox: A Meta-Analysis - Journal of Service Research (2007)
Read next
Reviewed by: Martijn den Otter · Last reviewed: 11/4/2026
Martijn den Otter
Oprichter van Neurofactor. Expert in neuromarketing en consumentenpsychologie.
LinkedIn →